
Even if we optimize all the aspects, we might still have a website that’ll take longer than we wished for. We can make use of several techniques to make the site apparently faster
We’ve seen in Website Performance Optimizations how we can make the website load faster. But there are times we can combine these improvements with others that will help to make the site apparently load faster. Even if the website is still loading, the user visualises most of the page in the shortest time possible, which translates in a good user experience and the perception that the site is fast.
Introducing webpagetest.org Speed Index
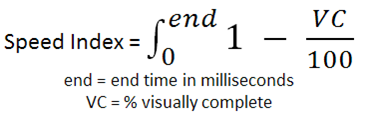
The Speed Index is the average time at which visible parts of the page are displayed. It takes the visual progress of the visible page loading and computes an overall score for how quickly the content painted. The lower the number the better.
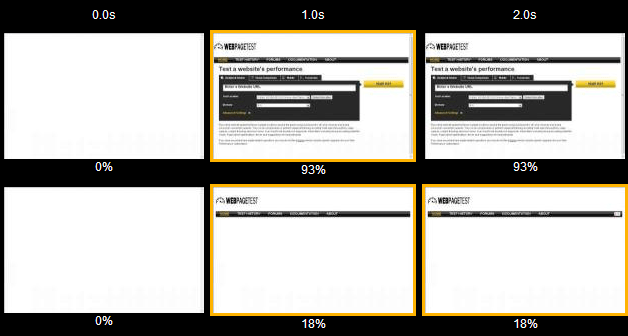
Let’s say the following website takes 6s to load. We can see the difference of a good apparent speed, by rendering 93% of the content in 1s and load the remaining 7% in 5s, and a not so good speed index, in which after 1s only 18% was loaded in 1s and only at 5s it loaded around 90%.
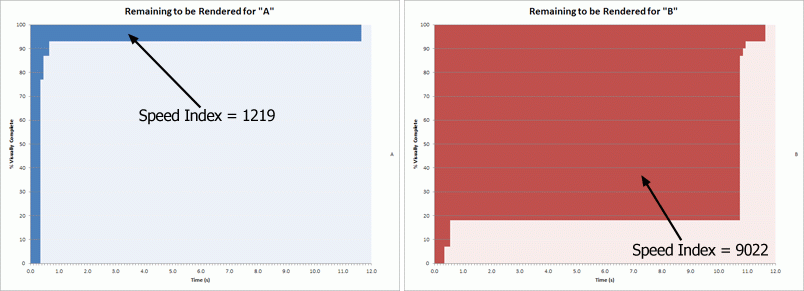
If we plot the completeness of a page over time, we will end up with something that looks like this:

The progress is then converted into a number by calculating the area under the curve:
Case-study shopcade.com
When I worked at shopcade.com, as part of a decision to provide a better user experience and also rank higher in search results, we’ve decided to tackle the page loading time (real and apparent). These improvements lead to higher conversion rates, but also, we started getting more and more indexed pages by Search Engines, and more frequently indexed. This eventually brought a lot of organic traffic to the website, along with other specific SEO improvements.
So, by applying the already mentioned performance optimizations (we also tweaked the backend framework, to get a much faster response time – Time to First Byte), we got these results:
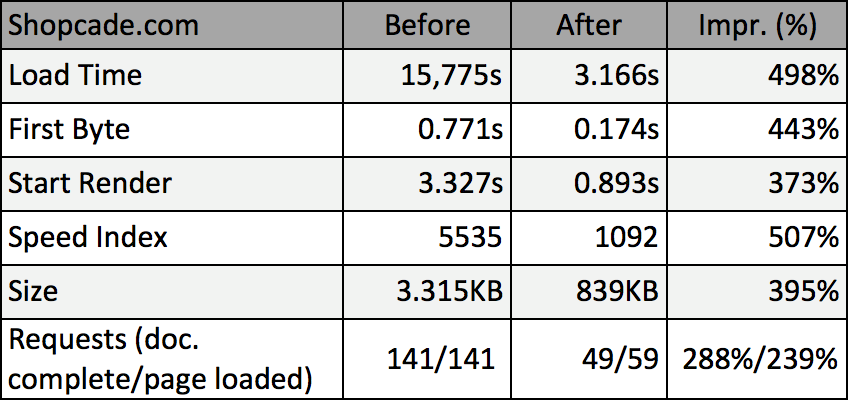
The DOM content loaded was triggered just after 0.6s, and we still triggered some scripts asynchronously, after the Content Download trigger. Check the before and after results on Webpagetest.org.
N.B. Just 1.3 seconds were to download a web font.
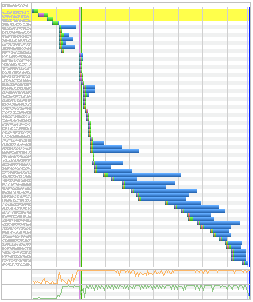
Below we can see an example of poorly optimized website:
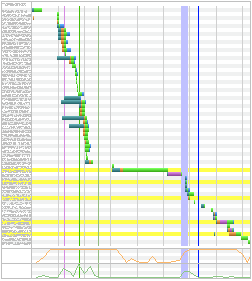
And here a better one:
What have I missed? Feel free to comment.